The “Free Money” Reality Check
With tuition costs climbing, the number one question for millions of families is simple: Will I have to pay full price?
The good news is that most students do not pay the sticker price.1 According to the latest 2024-2025 data from the National Center for Education Statistics (NCES), approximately 87% of first-year students receive some form of financial aid.2
However, “financial aid” is a broad term that includes loans you have to pay back. If you are looking specifically for free money (scholarships and grants), the numbers tell a different, more competitive story.
Key Statistics at a Glance
Before you bank on a full ride, you need to know the landscape. Here is the breakdown of who gets what in the current academic cycle:
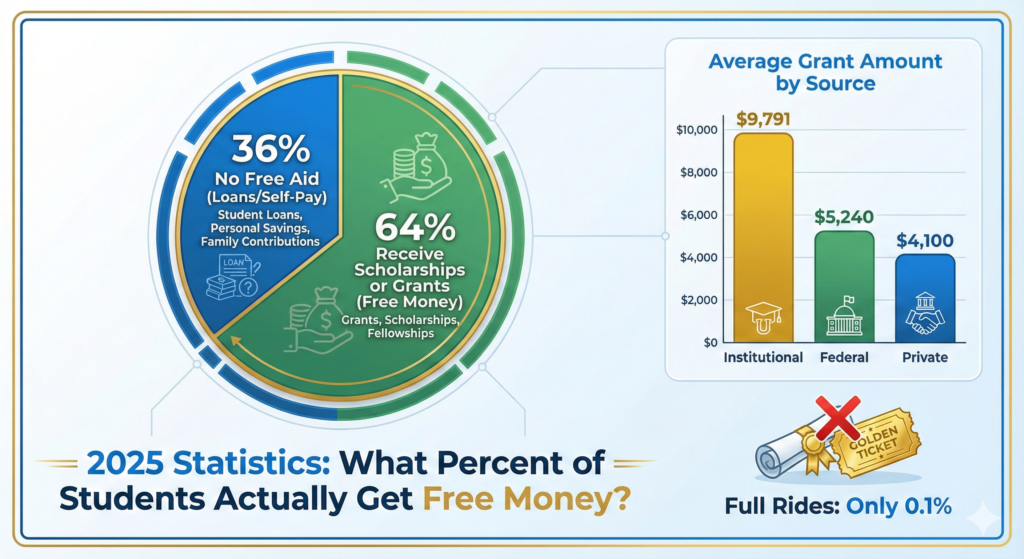
- 64% of undergraduates receive grants or scholarships (money you don’t pay back).
- 55% of students receive Federal Grants (like the Pell Grant).
- 40% receive Institutional Grants (discounts directly from the university).
- Only 13% secure a Private Scholarship (external awards from companies or nonprofits).3
Pro Tip: Your best odds aren’t with Coca-Cola or Google scholarships; they are with the university’s financial aid office. Institutional grants average nearly $10,000 per student, whereas private scholarships average closer to $4,000.
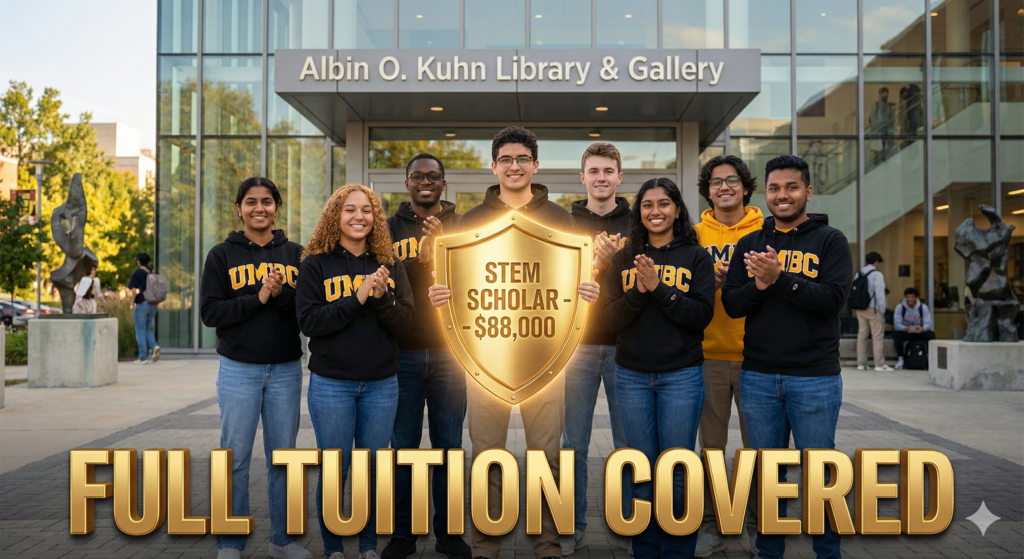
The “Full Ride” Myth: 0.1% Odds
We all dream of the “Golden Ticket”—a scholarship that covers tuition, room, board, and books. But how common are they really?
- Full-Ride Scholarships: Awarded to just 0.1% of students.4
- Full-Tuition Scholarships: Awarded to roughly 1.5% of students.5
What this means for you:
Do not build your entire financial plan around winning a single, massive award. The most successful students “stack” smaller wins: a federal grant + a university discount + two small local scholarships = a funded education.6
Who Gets the Money? (Demographics & Trends)
Financial aid isn’t distributed evenly.7 Factors like your choice of major, your GPA, and your background play significant roles.
1. By Institution Type
Private colleges have higher sticker prices, but they also have deeper pockets.
- Private Non-Profit Colleges: 89% of students receive institutional grants.
- Public Universities: 87% receive aid, but grant amounts are typically lower.8
2. By Demographics
Recent NCES data highlights trends in aid distribution:
- Gender: Female students are more likely to receive aid (84%) compared to male students (77%).9
- Ethnicity: Black students have the highest rate of grant receipt (~92%), followed by Hispanic students (79%), White students (70%), and Asian students (66%).10
Private vs. Public Scholarships: Where to Focus?
Many students waste hours applying for national “lottery” scholarships with thousands of applicants. Your time is money—invest it where the return is highest.
| Scholarship Type | % of Recipients | Avg. Award Amount | Competition Level |
| Federal (Pell) | 55% | ~$5,240 | Low (Need-based) |
| Institutional | 40% | ~$9,791 | Medium |
| State Gov. | 16% | ~$3,479 | Low/Medium |
| Private/External | 13% | ~$4,100 | High |
Strategic Takeaway: Always prioritize the FAFSA and your university’s internal aid application. These are your “high-probability” targets.
How to Be in the Top 1% of Applicants
If you want to beat the odds in 2025, you need a strategy that goes beyond good grades.
- Go Local: Local Rotary clubs and community foundations often struggle to find applicants. Your odds here can be as high as 1 in 10, compared to 1 in 10,000 for national contests.
- Highlight “Spiky” Traits: Don’t just be a well-rounded student. Scholarship committees look for specific “spikes”—like a unique hobby, a specific volunteer project, or a niche skill.11
- Apply Year-Round: Most students stop applying after high school. However, 50% of scholarships are available to current college students. Keep applying every year.
Conclusion: Control Your Financial Future
While only 0.1% get a full ride, 64% get free money. The difference between graduating with debt and graduating debt-free often comes down to persistence, not perfection.
Start by maximizing your federal and institutional options, then aggressively target niche, local private scholarships.